
Reports
Overview
Depending on the support package you have, we provide various set of reports. You can check reports available for you in Analytics section in the Menu.
Azure Managed Services Reports
For all our customers with Azure managed services contracts we provide a set of online dashboards to track various aspects of Azure consumption, status of the infrastructure and many other details:
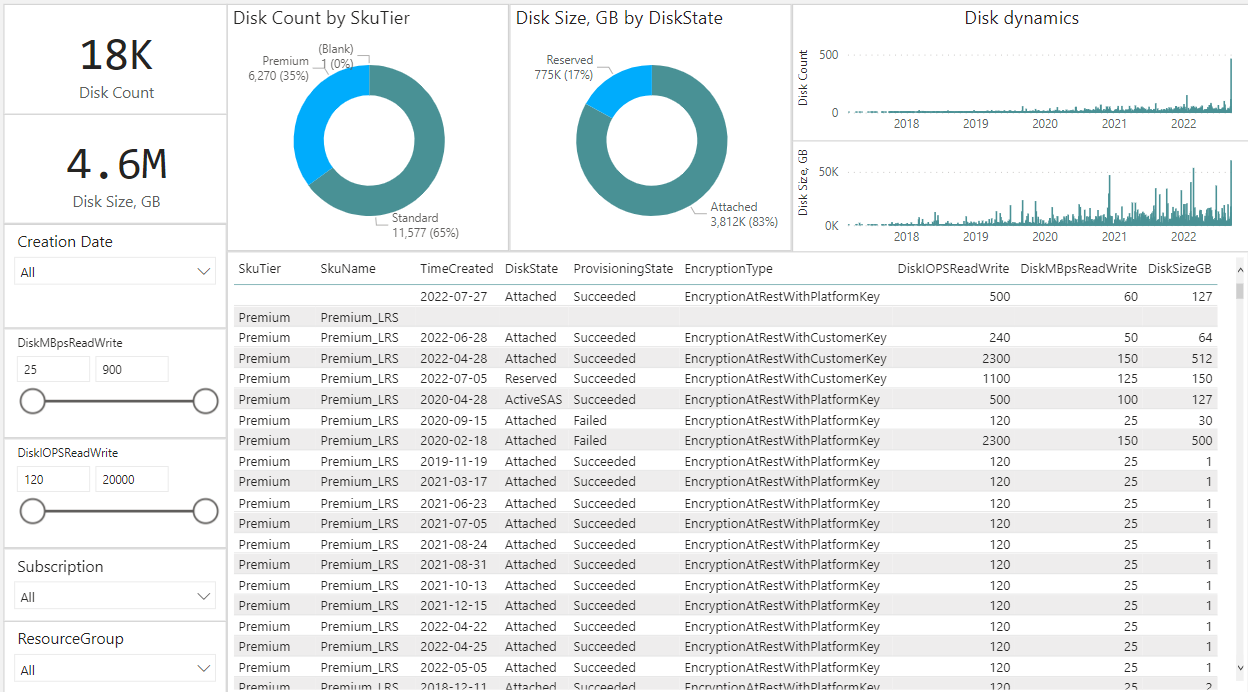
Infrastructure overview – detailed analytics of your infrastructure – for VMs, Discs, SQL DBs and Storage accounts.
You can see VMs count by location, VM group and OS type, filter by subscription ID, Resource group and tags. Disks analytics gives you visibility on count and size dynamics, tier and status. SQL you can analyze by type, SKU tier and name, location and Tags. Storages – kind, location, SKU tier and name.
Separately we provide you visibility on Tags coverage for all resources in your subscriptions.
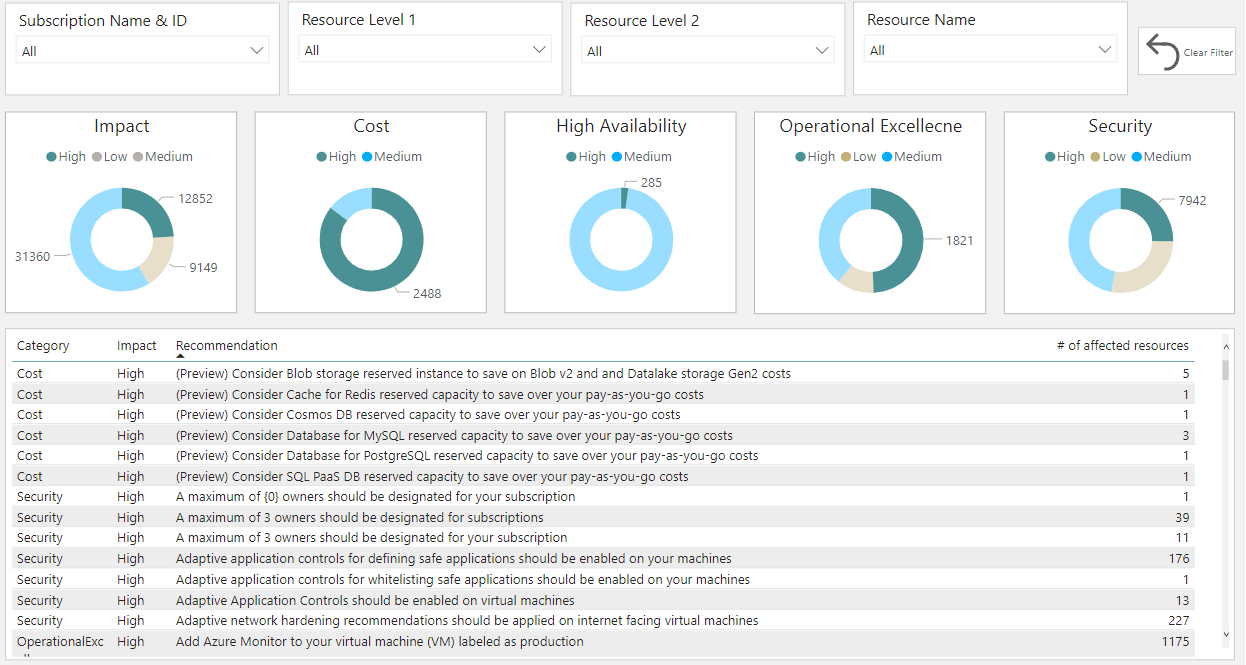
Recommendations report gives you an overview of the potential improvements we recommend you implement in your Azure infrastructure. Recommendations are grouped by type (Cost, HA, Operational Excellence and Security) and by Impact.
Let us know if you want to implement any of our suggestions by raising a Service request (https://support.noventiq.com/tickets/create).
Usage Details is an overview of your Azure consumption with several important filtering options. You can analyze Azure costs by Resource location, Resource Group, Category. You can check top-10 most expensive VMs, Storages & SQL DBs. You can see how your consumption changes over time and use it in your cost optimization planning
Service performance dashboard is a report on services we provide as a part of your MSP package. How many incidents and service requests were raised during the last week, month, or quarter. What were the last 5 Changes we implemented, how many monitoring alerts we received and responded to, how many problems we analyzed and solved. What types of alerts do we get the most, what resources generate most of them?
In Detailed view page of this report you can also see all tickets history, including archived ones from the previous portal. SLA detail pages shows you the dynamics of the requests and SLA conformance – for Incidents, Major Incidents, Service requests and Changes. CI details view gives you another angle to you infrastructure – what types or resources you have under management, how many created and/or deleted recently.
Consumption Reports
For our customers with contracts for Assistance and Consulting Services in T&M format, we provide online dashboard to track services consumption. In this report you can see number of open tickets and consumed hours, along with the cost (including archived data) and SLA conformance.
If Data in Your Reports is Inaccurate
If you see that some part of the data in our reports for some reason is not 100% accurate, or if you have questions related to any of our reports – please, raise a Service request using this page (https://support.noventiq.com/tickets/create).